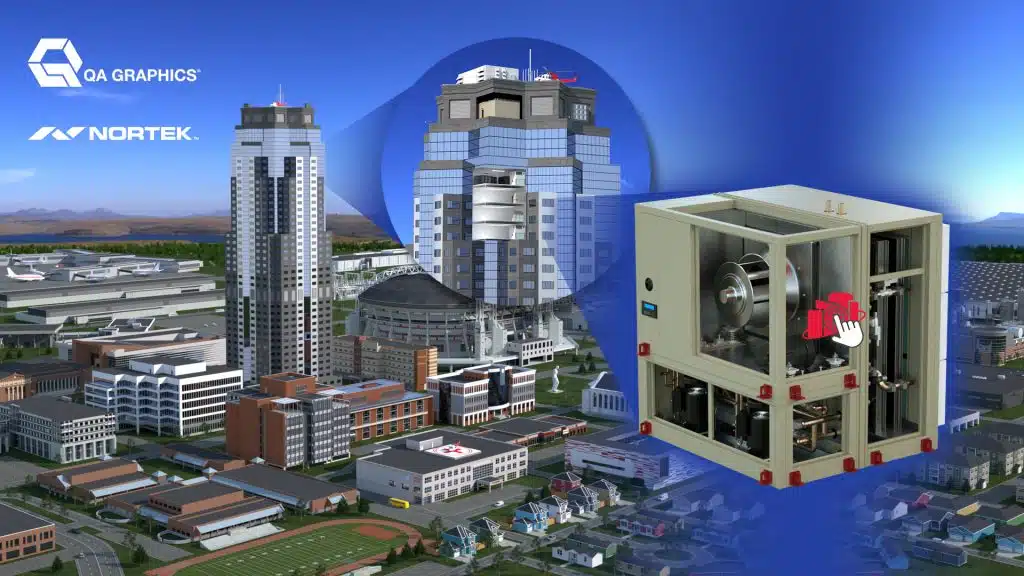
Educate Students with Real Time Data & Become LEED Certified
QA Graphics’ award winning Energy Dashboard, educates building occupants with energy data and green building features using a kiosk or desktop, tablet, or mobile device. The Energy Dashboard creates occupant awareness through the display of building performance data, demonstrations of sustainable building features, tips on how to be efficient and other educational features. Integrate your building data into your institution’s curriculum, and allow your students to work on assignments with real-time data. Energy Dashboards can help your building become LEED certified too.
Translate Data into Course Work
An Energy Dashboard was integrated to work with St. Michael’s College to educate their students about their green building features and energy efficiency practices. For the fourth straight year, St. Michael’s College was named in The Princeton Review’s Guide to 322 Green Colleges.
Translate utility data into easy-to-understand values (e.g. “48,500 gallons of water have been saved. That is enough to wash 1,080 loads of laundry.”)

“It wasn’t your typical dashboard that just showed real time energy usage, but it allowed us to focus on why knowing energy usage was important and had features that could explain to students what a kilowatt was. We also found the ability to make it our own incredibly enticing.”
– Heather Lynch, Sustainability Coordinator/Associate Director of Facilities at St. Michael’s College


