 Display Your Data with Custom Charts and Graphs
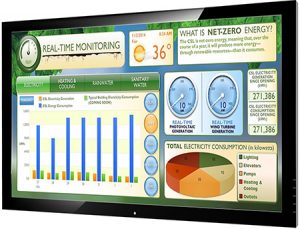
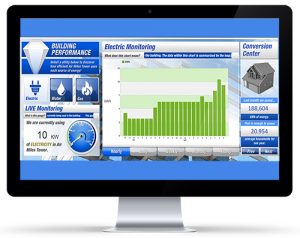
QA Graphics has created another Energy Dashboard option for those who want the easy to read charts and graphs without the interactive features. The Executive Dashboard gives you live, real-time data through building performance metrics in a custom design. The Executive Dashboard is integrated with Energy Star and can be viewed on web or mobile devices.
QA Graphics’ award winning Energy Efficiency Education Dashboard® (EEED), educates building occupants with energy data and green building features using a kiosk or desktop, tablet, or mobile device. The EEED creates occupant awareness through the display of building performance data, demonstrations of sustainable building features, tips on how to be efficient and other educational features. All data that is obtained for the EEED is your own to use.
- Demonstrate an organization’s sustainable pursuits and achievements
- Compare building performance data between floors and/or other buildings
- Translate utility data into easy-to-understand values (e.g. “48,500 gallons of water have been saved. That is enough to wash 1,080 loads of laundry.”)

